How to Monitor the Economy Like a Pro: Your Real-Time Dashboard for Market Survival
The Economy Feels Fine. The Plumbing Says Otherwise.
If you read the headlines, the economy is either booming, teetering, or in a Schrödinger’s catcession we’ll only know about after it’s over.
GDPNow is flashing strength, equities are up double digits, and yet—deep in the charts…
The U.S. financial system looks like it’s breathing through a straw.
Set the Scene
Over the past year, I’ve been running a macro dashboard in TradingView that mashes together the “official story” and the “under-the-surface story.” It’s a mix of real-time tools born after the Global Financial Crisis—GDPNow, the Weekly Economic Index, the Chicago Fed’s National Financial Conditions Index—plus the housing affordability metrics no one likes to look at because they ruin the open house fantasy.
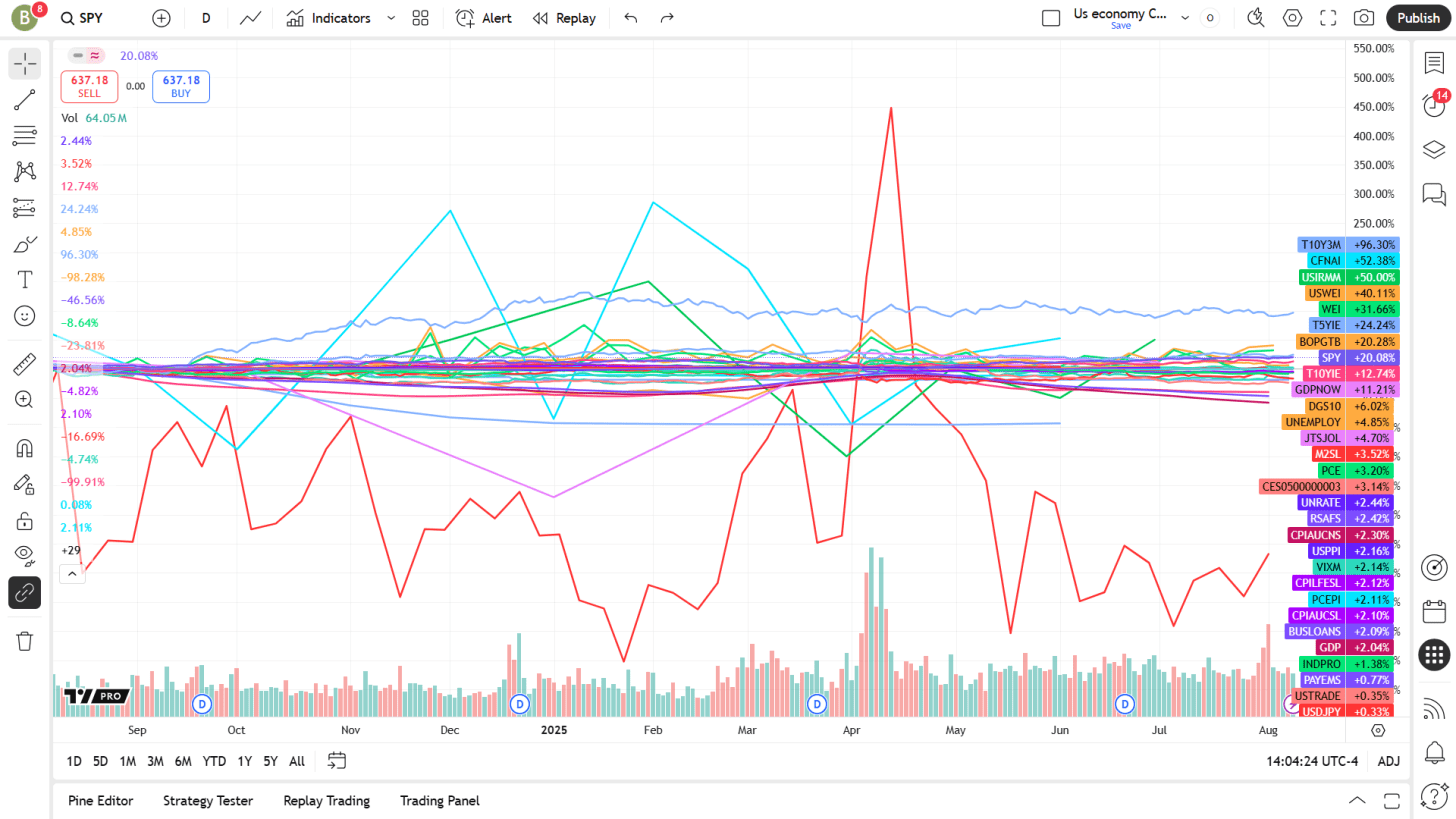
On the surface? SPY +20%. GDPNow still showing growth.
Underneath?
NFCI, NFCIRISK, NFCICREDIT all screaming tighter financial conditions than at any point since the pandemic crunch.
Borrowing growth is flat.
Affordability indexes are sinking even as mortgage rates tick down.
It’s like finding a hairline crack in the foundation of your new house.
What the Readings Say Now
We’re in a cautious resilience regime:
Growth: still there.
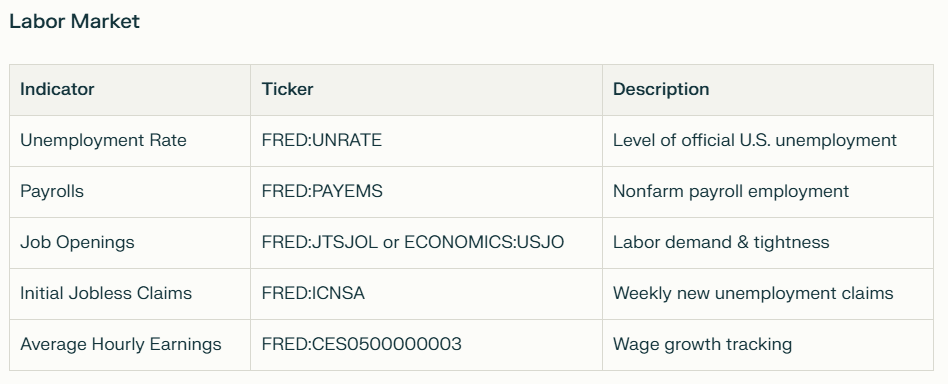
Jobs: cooling but stable.
Inflation: sticky 2–3%.
Liquidity: tight.
Housing: resilient but eroding under the surface.
Markets: risk-on, but not frothy.
This isn’t an “all-clear” economy; it’s an economy holding together while the credit pipes creak.
Thanks for reading Crazy Good. This post is public so feel free to share it
Share
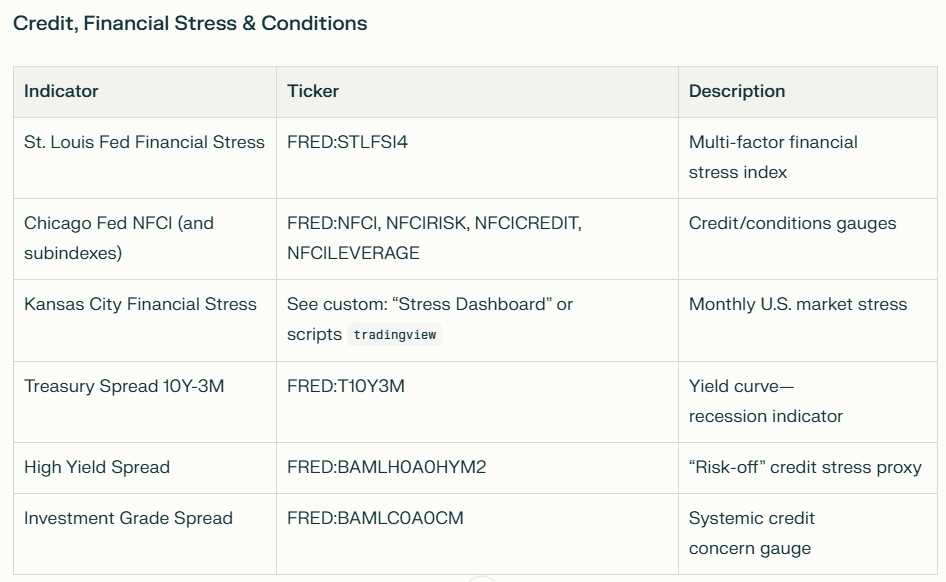
Let’s Define Some of the Metrics in These Charts
Head Check: Growth Pulse vs. Reality
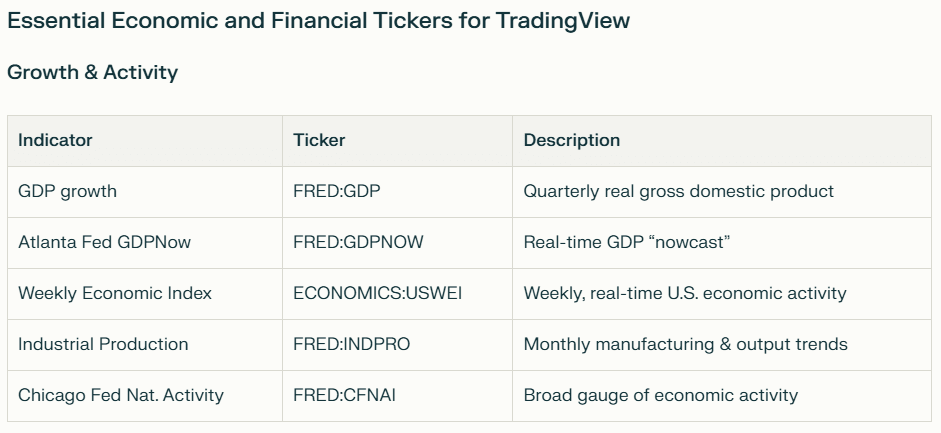
What do growth and activity look like?
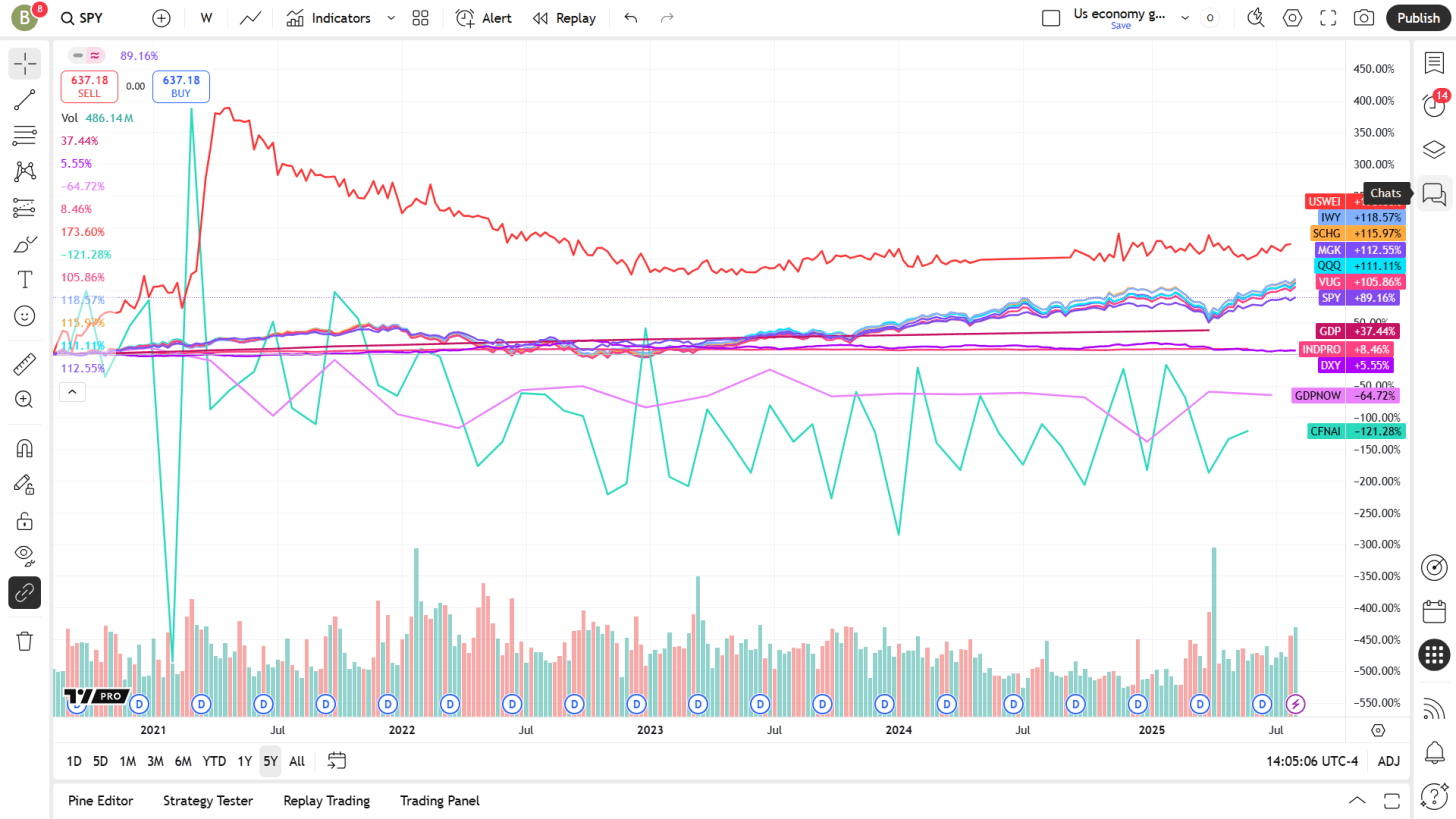
What’s solid: GDPNow (FRED:GDPNOW) and the Weekly Economic Index (ECONOMICS:USWEI) are both positive—this isn’t a collapsing economy.
The catch: High-frequency growth tools tell you what’s happening now, not what’s already been baked into credit and liquidity conditions.
What to watch: If WEI starts sliding while NFCI remains tight, that’s when growth resilience becomes stall speed.
HEAD CHECK: Do you believe the flow of the economy (GDPNow) more than the plumbing (NFCI)?
Which one gets priced into your decisions first?
Heart Check: Financial Stress and the Nervous System of the Market
Some other important things that don’t get a lot of press.
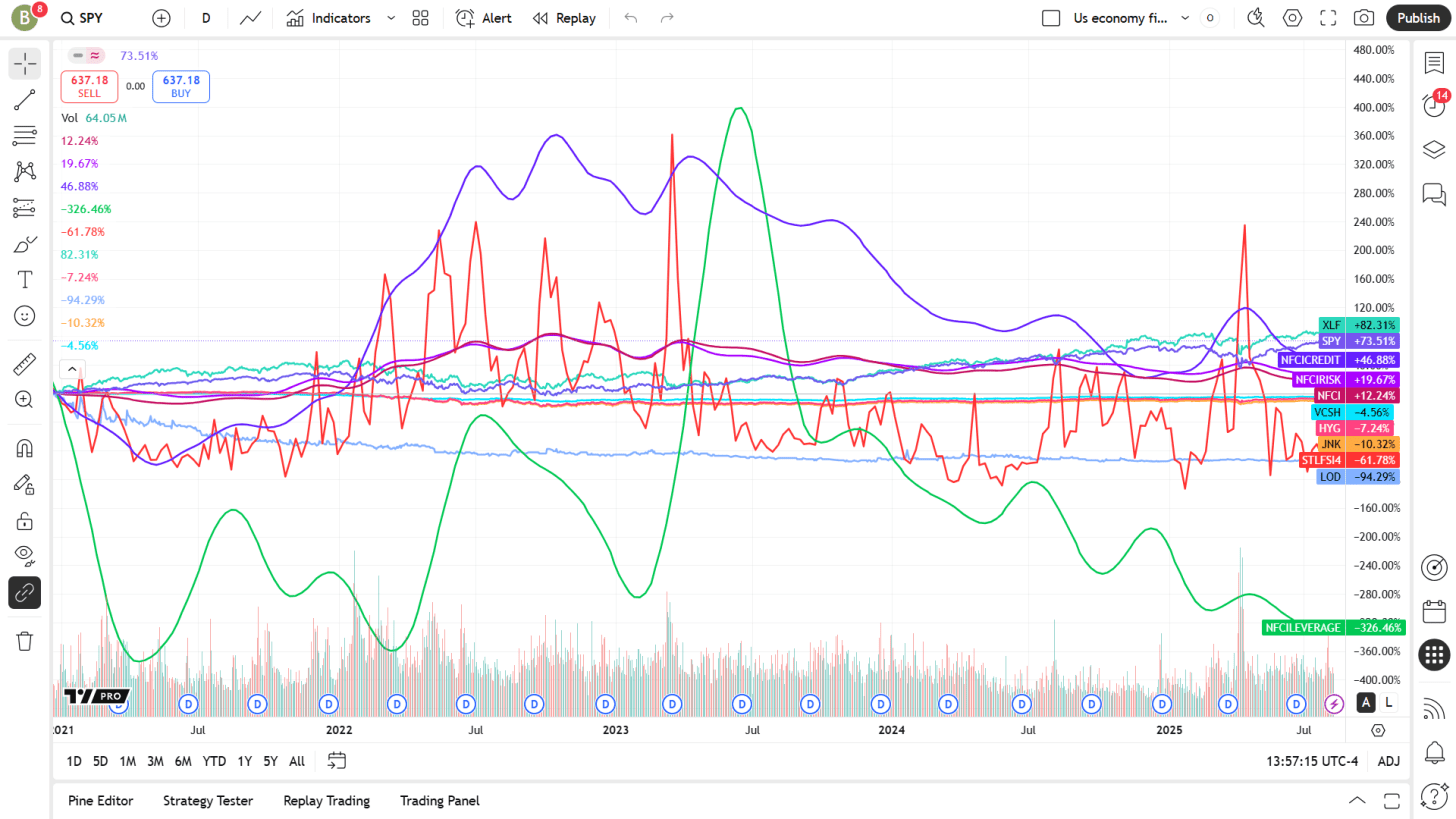
NFCI family (FRED:NFCI, FRED:NFCIRISK, FRED:NFCICREDIT, FRED:NFCILEVERAGE)These metrics are the blood pressure machines of the financial system. All are well off their easy-money lows, some down 50%+ in the past year. Banks are tight with loans.
Interpretation fight: Are they a leading warning or just a reflection of Fed policy? Tight financial conditions can persist for years without a crash—until they can’t.
What to watch: Credit spreads (FRED:BAMLH0A0HYM2, FRED:BAMLC0A0CM). If spreads widen sharply while NFCI stays tight, risk appetite will shift fast.
HEART CHECK: How much financial stress do you tolerate in your portfolio before you change positioning?
Gut Check: Housing Reality Check
What’s really going on with the housing market?
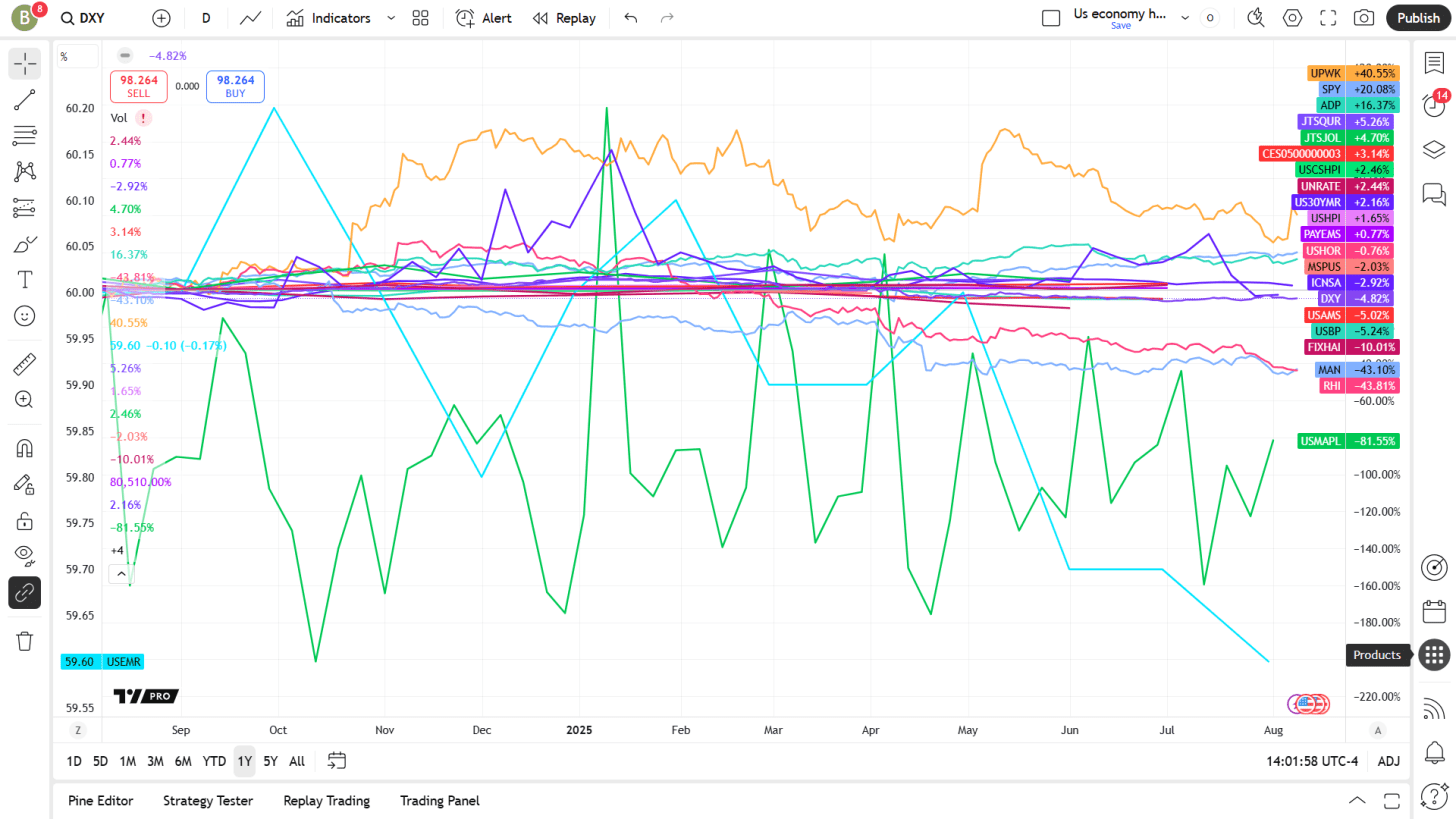
Housing and Labor economic metrics over the last 1 year.
Case-Shiller (USCSHPI) vs **Median Sales Price (MSPUS)**One says up, the other says down. Case-Shiller lags and skews toward larger metros; median prices reflect mix shifts but catch turnarounds faster.
Affordability Index (FRED:FIXHAI) is down ~7% YTD despite a small drop in 30-year mortgage rates (FRED:MORTGAGE30US).
Key tension: Mortgage applications are up (ECONOMICS:USMAPL), but average mortgage size is down—buyers are adjusting expectations, not winning the affordability war.
GUT CHECK: Are you pricing housing on the index that fits your bias, or the one that fits the market’s reality?
Scenarios & Tripwires
Soft Landing: NFCI eases, growth holds → equities keep climbing, housing stabilizes.
Stall Speed: Growth fades, NFCI stays tight → sideways markets, credit accidents possible.
Credit Shock: Stress indicators spike → risk assets correct, safe havens bid.
Tripwires: sudden WEI drop, spread blowout, NFCI spike, affordability index freefall.
Life Change
Build your own clarity. Don’t outsource your nervous system to headlines.If you want to know when the story changes, track:
FRED:GDPNOW, ECONOMICS:USWEI, FRED:NFCI, FRED:NFCIRISK, FRED:NFCICREDIT, FRED:NFCILEVERAGE, FRED:FIXHAI, USCSHPI, MSPUS, FRED:MORTGAGE30US
… and keep them on one screen. When the growth line bends while the stress line spikes, you won’t need a headline to tell you what to do.
LIFE CHANGE: Do you want to be distracted by incomplete, spun news headlines, or give yourself the numbers and context for clarity?
I may make my Trading View econonometric charts public at some point so you can just click over to them. Let me know if you want that!
Here’s the everything one for now.
If you enjoyed this, please do one of the following!
Leave a comment
Share
Subscribe now